

America’s Most Splendid Housing Bubbles: Price declines have spread across the United States. Biggest monthly falls since Housing Crisis 1 in San Francisco -3.5%, Seattle -3.1%, San Diego -2.5%
The Case-Shiller index, which lags several months, begins to swing market by market, notably in Phoenix, Dallas, Washington DC and Boston.
By Wolf Richter for WOLF STREET.
A month ago, the S&P CoreLogic Case-Shiller home price index, which lags the reality of the real estate market by 4 to 6 months, began to register the first month-to-month price declines. other, all in the West: the metros of Seattle, San Francisco, San Diego, Los Angeles, Denver and Portland.
These price declines have now steepened sharply, according to Case-Shiller Home Price Index, and the price cuts are now spreading across the United States, including Boston, Phoenix, Dallas, and Washington DC. And what a huge shock, even in San Diego, America’s most splendid No. 1 housing bubble, prices fell 2.5%, the biggest monthly drop in the metro since Housing Bust 1.
That the housing market is seriously weakening in terms of sales and prices in the United States showed up in other data that was more immediate but easily skewed by changes in the mix of what was sold. California’s housing market is among the frontrunners, with dismal sales volume and steeply falling prices. In major Bay Area counties, including San Francisco, median prices are below where they were a year ago, and even in Southern California, they are slumping in earnest.
Today’s release of the Case-Shiller Index was for “July,” which is the three-month average of closed home sales that were registered in public registers in May, June and July. Due to the time lag between when an agreement is reached to sell a home and when the “closed sale” is recorded on public records, the current timeframe for “July” roughly covers transactions completed from April to June. During this period, the average 30-year fixed mortgage rate was between 5% and 6%.
The most splendid real estate bubbles where prices have fallen.
In the San Francisco Bay Area, real estate prices fell 3.5% in “July” (three-month moving average of May, June and July) from June, the largest month-over-month decline since February 2012, to the low of housing collapse 1, after fell 1.3% in June.
These two declines came after the ridiculous peak of the past two years and reduced the year-over-year gain to 10.8%, from 16% the previous month and more than 24% earlier this year. A few more dips like this, and the index will catch up to the median price and be negative year over year.
For the Case Shiller index, the metro includes the five counties covering San Francisco, part of Silicon Valley, part of the East Bay and part of the North Bay.
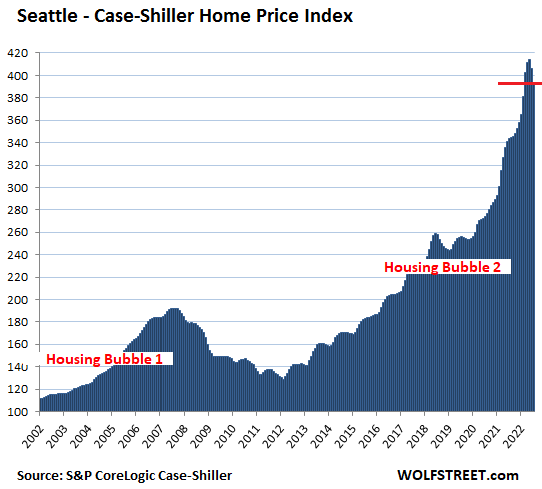
In the Seattle metro, real estate prices plunged 3.1% in “July” from June, the biggest month-over-month fall since January 2009, at the height of the housing crisis 1. This followed the 1.9% drop the previous month. The two dips combined wiped out the previous four months of gains, dropping the other side of a totally ridiculous peak. That reduced the year-over-year gain to 8.4% from 27% earlier this year.
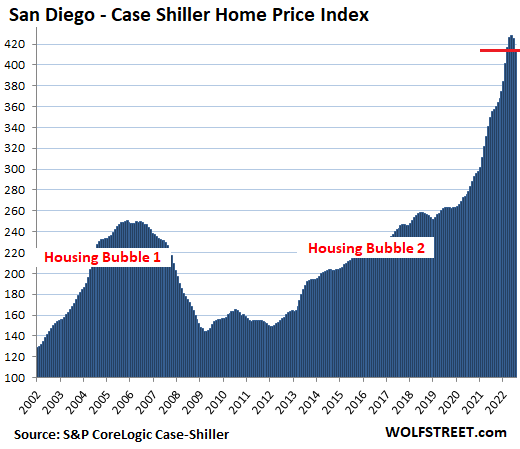
Home prices in metro San Diego fell 2.5% in “July”, the largest month-over-month decline since January 2012, and the second consecutive month-over-month decline, after a most ridiculous peak. The index is now below the March level. This reduced the year-over-year gain to 16.6%.
The index value of 414 for San Diego means home prices have jumped 314% since January 2000, when the index was set at 100 (over the same period, the home price index consumption increased by 75%). San Diego’s index has now fallen to the same level as Los Angeles’ (414), and the two share the honor of being America’s No. 1 most splendid housing bubble.
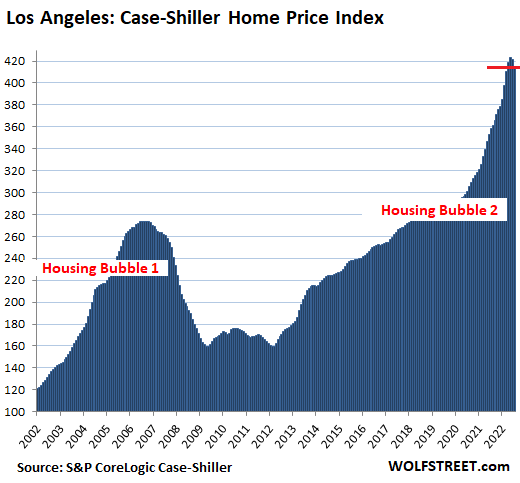
In the Los Angeles metro, real estate prices fell 1.6% in July compared to June, the largest drop since March 2012, and the second consecutive month of declines. This reduced the year-over-year price increase to +15.7%.
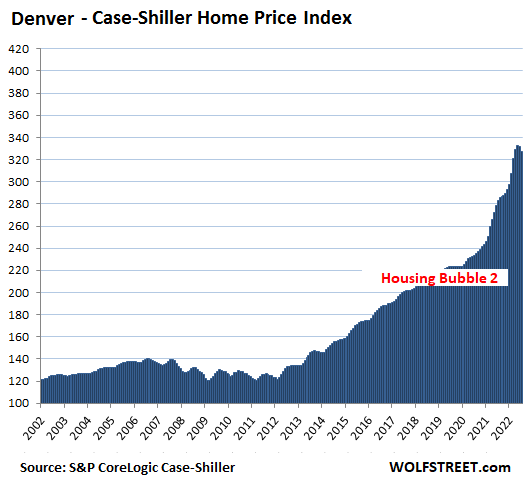
Home prices in metro Denver fell 1.4% in July compared to June, the second consecutive month of declines, reducing the year-over-year gain to 15.6%:
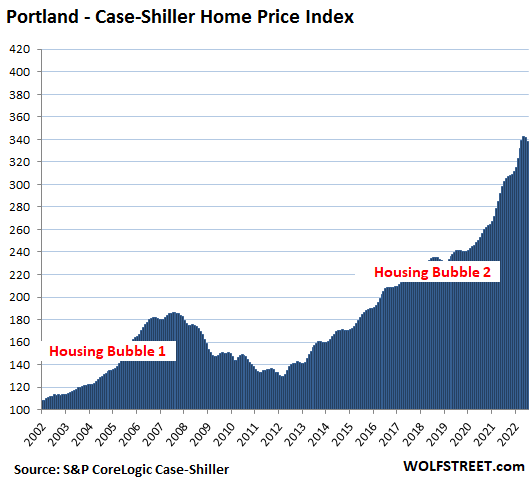
Portland metro home prices fell 1.1% in July from June, the second straight month of declines, after a ridiculous spike. This reduced the year-over-year gain to 11.7%:
The Case-Shiller index uses the “sales pair” method, comparing sales for the current month to those of the same homes sold previously. Price changes within each sell pair are incorporated into the metro index and adjustments are made for home improvements (methodology). By tracking the change in dollars it took to buy the same house over time, the index is a measure of house price inflation.
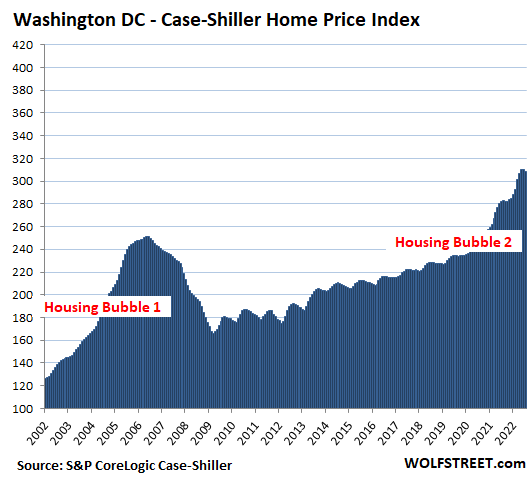
In the Washington DC metro, real estate prices fell 0.7% for the month, after being stable the previous month. This reduced the year-over-year gain to +9.4%:
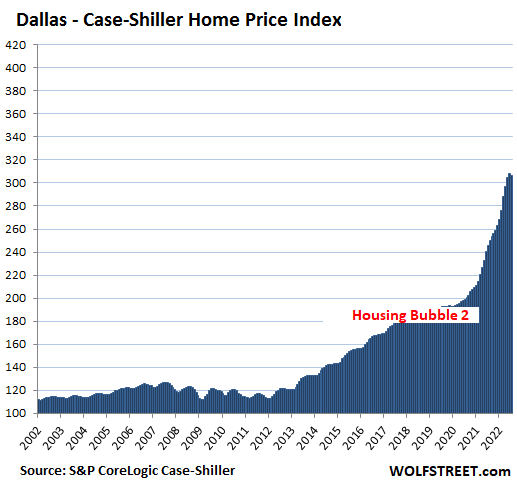
In the Dallas metro, prices fell 0.4% for the month, the first decline since 2019. And while it appears to be a small decline, it was the largest decline since October 2012. That narrowed the year-over-year gain to 24.7 % from the range of 30% and higher earlier this year. .
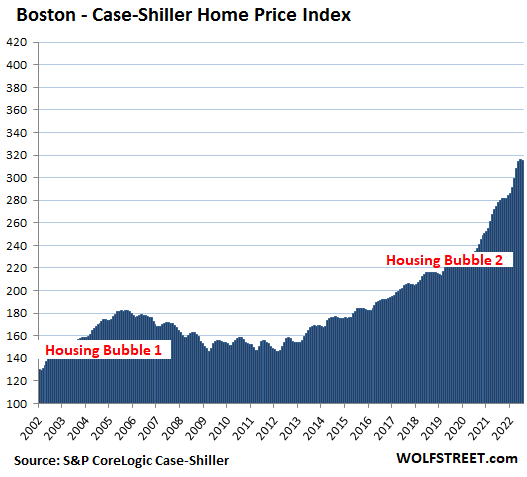
In the Boston metro, house prices fell 0.3% for the month, which reduced the year-over-year gain to 13.3%:
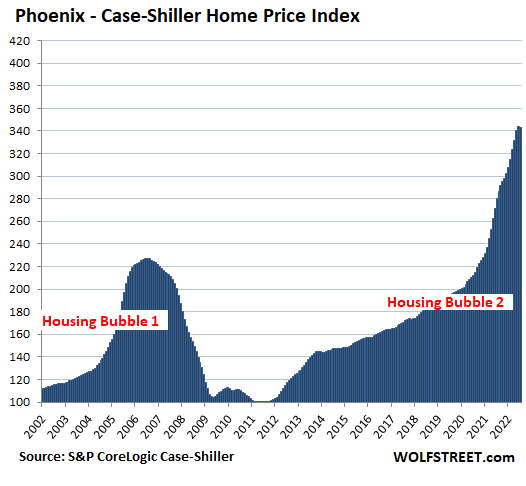
Home prices in metro Phoenix edged down 0.1% for the month, so roughly flat, after the huge spikes at the start of this year and last year. This reduced the year-over-year gain to +22.4%, from +32% earlier this year:
The most splendid housing bubbles where price gains have “decelerated” or stagnated.
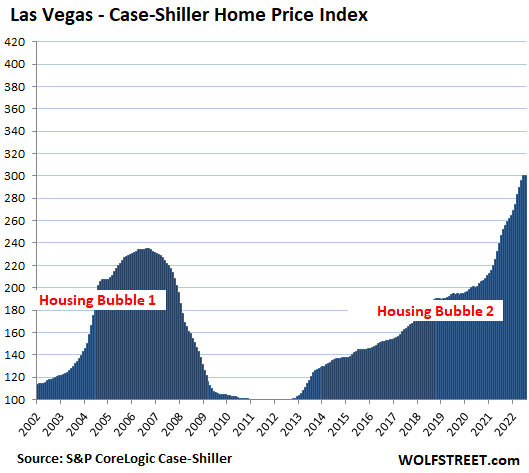
Las Vegas Metro: prices stagnated and remained unchanged for the month, compared to jumps of around 3% earlier this year. This reduced the year-over-year gain to +21.8%, from the 28% range earlier this year:
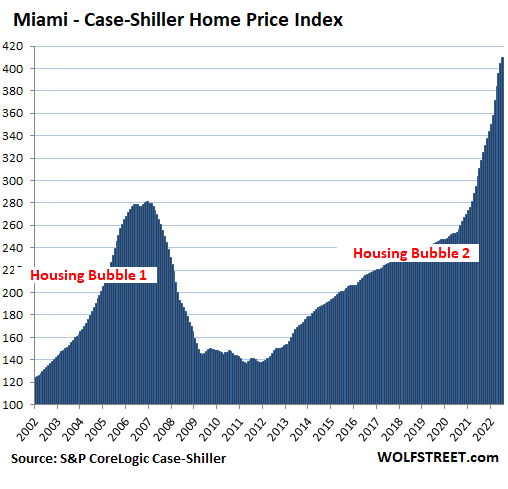
Miami Metro: +1.3% for the month, “decelerating” from month-over-month gains of around 3.5% in previous months. That reduced year-over-year gains to a still ludicrous 31.7%, from +33% in June and +34% in May.
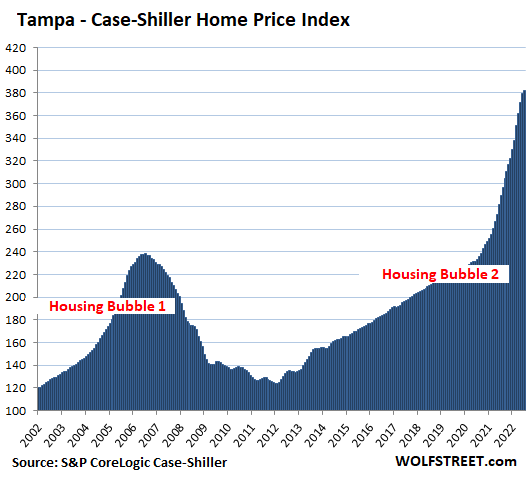
Tampa Metro: +0.6% for the month, decelerating from gains of over 3% earlier this year. That reduced the year-over-year peak to 31.8% from 36% the previous month, still solidly in ridiculous territory.
In the New York subway: +0.2% for the month, decelerating from the +1.5% range in previous months, which reduced the year-over-year gain to +13.7%:
Based on the Case-Shiller index value of 276, metro New York has experienced housing price inflation of 176% since January 2000. The remaining cities in the 20-city Case-Shiller index ( Chicago, Charlotte, Minneapolis, Atlanta, Detroit and Cleveland) have experienced less house price inflation and are not eligible for this illustrious list. Among them were monthly declines in Detroit (-0.1%) and Minneapolis (-0.2%).
Do you like to read WOLF STREET and want to support it? You use ad blockers – I completely understand why – but you want to support the site? You can donate. I greatly appreciate it. Click on the mug of beer and iced tea to find out how:

Would you like to be notified by e-mail when WOLF STREET publishes a new article? Register here.
![]()
Comments are closed.